A Simple Hue Transformation

A while ago I needed a way to calculate colors. I wanted an easy way to get bright colors. I wanted it to be simple, taking a single hue parameter and mapping it into an RGB color.

The solution I found is to choose the red, blue and green channel values as overlapping trapezoids. The color is supposed to be cyclic, so I could used the fmod function in C++ or the % remainder operator in JavaScript. The result would transform any floating point argument into the base domain of\(\lbrack 0, 1)\).

Color map from zero to 1

The algorithm picks the values according to the above graph. As the hue argument moves from zero to 1, each color has a section where it is at its maximum value, part where it is zero. Between the two extremes is a linear transition. A zero value maps to zero in the corresponding RGB component while a 1 gets mapped to 255.

I’ve tried different curves for the transitions and the linear slope seemed to be the best compromise to make bright colors.

What I created is diagrammed here

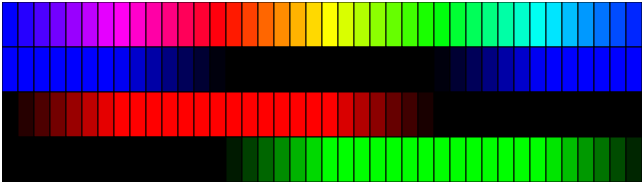
This shows the colors broken into the individual red, green and blue channels.

By changing the shape of the basis curves, different results can be obtained. This trapezoidal function was chosen in the end because it gives really bright colors and is simple to implement. (Also, I have a long-ago program that already uses this design and if I want to replicate it online, I need the same algorithm.)

The following code in JavaScript calculates the function.


var color = (function() {
    const coords = [ 0, 1, 1, 1, 0, 0, 0];
    const factor = 6;
    const red = 0;
    const green = 2/3;
    const blue = 1/3;

    function fromHue( hue ) {
        hue = ((hue % 1) + 1) % 1;
        const index = Math.floor( hue * factor );
        const fraction = hue * factor - index;

        return coords[index + 1] * fraction + 
                        coords[index] * (1 - fraction);
    }

    return function( hue ) 
    { 
        let r = Math.round( 255 * fromHue( hue + red ) );
        let g = Math.round( 255 * fromHue( hue + green ) );
        let b = Math.round( 255 * fromHue( hue + blue ) );
        if( r !== r || g !== g || b !== b ) { 
             r = g = b = 0; 
        }

        return `rgb(${r},${g},${b})`;
    }
})( );

The coords array specifies the function’s value at each of the evenly spaced corners. The seventh value matches the first so that the curve is cyclic. Each hue that is not at a vertex will be a linear interpolation of the two quantities to the left and right. You can verify the values in the coords array by reading the red graph at the marked points on the hue axis. The coords table adds flexibility because different coords array and adjusting “factor” to match it can create other spectra.

Each color is out of phase by 1/3, Thus adding 1/3 and 2/3 to the hue will shift the graph so that the same trapezoidal curve can be used for each of the red, green and blue channels. Blue is 1/3 rather than green because if you shift the blue graph to the right by 1/3, it lines up with the red graph while green must shift right by 2/3 to match.

Inside the fromHue( ) function, the “((hue % 1) + 1) % 1” expression looks peculiar. The % operator returns the remainder of a division. For positive hue, the remainder of dividing by 1 is the fractional part. If hue is negative, the remainder will negative, between -1 and 0. Adding 1 and then calculating the remainder of that will map the entire domain for each color channel to the range [0, 1) without needing an “if.” By mapping hues into that range of 0 to 1, it is as if the above diagram repeats indefinitely to the left and right along the hue axis.

The Math.floor() operation takes a hue times six and converts it into an integer index for the coords array. By multiplying by 6, the corner points have integer indices and the fractional part left by subtracting index can be used to do the interpolation.

In the return statement of fromHue( ), “index + 1” accesses the value of the function to the right of the calculated fraction. Since the points of the coords array are 1 apart, the slope is \(coords\lbrack index + 1\rbrack – coords\lbrack index\rbrack\)

In point slope form, the value is

$$coords\lbrack index\rbrack + (coords\lbrack index +1\rbrack – coords\lbrack index \rbrack ) * fraction$$

Combining the two references to \(coords\lbrack index \rbrack\) results in the expression above.

After calling fromHue(), the calls to Math.round( ) take each component and map it to an integer from 0 to 255. The text that it returns is appropriate for using for the color in styles and graphic contexts.

The final “if” statement detects when the results are NaN and replaces that with black. NaN is the only value that is not equal to itself. Whenever the argument hue is not a number, fromHue( ) will return NaN.

For example, if hue were 1.6, for Red, the first expression would replace hue with 0.6. Then, index would be Math.floor( 6 * 0.6 ); or floor( 3.6) or 3. Fraction would be 0.6. Coords[ 3 ] is 1 and coords[4] is 0. The result then is 0 * 0.6 + 1 * (1 – 0.6) which evaluates to 0.4. Then, red would be set to Math.round(255 * 0.4) which is 102. For Green, fromHue would be given about 2.267 which changes to 0.267 when you take the remainder. Index would be Math.floor( 6 * 0.267 ) or floor( 1.6 ) or 1. Coords[1] and coords[2] are both 1 so the return statement would return 1. This would then become 255. For Blue, fromHue would be given about 1.933 which would become 0.933. This leads to an index of 5 and fraction of 0.6. Coords[ 5 ] and coords[ 6] are both 0 so blue would be 0. Since none of these are NaN, the result would be the string “rgb(102,255,0)”

Because the corners in the trapezoidal shapes are positioned at constant intervals, the algebra is simplified. Without a repeating shape or with unevenly spaced key points, the algorithm would need an inelegant sequence of ifs to calculate the curves.

An Expanded Multiplication Table

In the Dune stories, mentats are trained to do complex calculations without any mechanical aids. For normal people, instantly knowing the multiplication up to 10 is a useful skill. Extending the multiplication table to twenty seems to require the skills of a mathematical savant.

However, calculating products of up to 20 actually only requires the single digit multiplication table and the ability to add small numbers mentally. My goal is to be able to do these calculations without paper. How?

If one of the numbers is single digit and the other is between 10 and 20, the calculation works like this:

A number between 10 and twenty can be written as \(10 + a\) or \(1a\). For the results you have one single digit multiplication an addition of a number times ten.

$$1a * b = (a*b) + (10 * b)$$

Since \(10 * b\) is just \(b\) shifted left by one, you can get the result by identifying \(a*b\) and then adding \(b\) to the second digit.

$$1\color{blue}{5} * \color{red}{7} = (\color{magenta}{35} + \color{red}{7}0) = 105$$

The mental steps are “calculate \(\color{blue}{5} * \color{red}{7}\)” and then “add \(\color{red}{7}\) to the second digit.”

For the product of a single digit times and a number under twenty, you always use the normal multiplication table and single digit addition.

If both numbers are between 11 and 19, the calculation works out this way.

$$a * 1b = (10 +a) * (10 + b) = a * b + 10 * (a + b) + 100$$

To start, multiply the singles place values. For example \(1\color{blue}{5} * 1\color{red}{7}\) starts as \(\color{magenta}{35}\).

Then add \(\color{blue}{5} +\color{red}{7}\), giving \(\color{orange}{12}\).

Add that in the 10s place \(\color{magenta}{35} + 10 * \color{orange}{12}\) giving \(\color{brown}{155}\) and finally, increment the hundreds digit, giving \(\color{green}{255}\)

This involves multiplying single digit numbers, adding a pair of single digits, adding a digit and a number less than twenty and incrementing a digit. It works out to needing having six or so digits in mind at once which can be less than one’s estimated working memory of 7 digits.

If one of the numbers is 10, add a zero to the right of the other value. For twenty, double the other number and add a zero. Now there’s a simple way to multiply two numbers where both are 20 or less.

With a little practice, I can do this in my head. More importantly, I’m confident of my result so that I’m getting so that I don’t need to double check on a calculator.

Word Greek Letter Cheatsheet

I’ve attached this as a PDF. It’s a chart of how to enter all of the Greek letters in an equation region in Microsoft Word. It also includes a second table of common symbols including arrows and logic symbols.

To use these abbreviations in Word’s equation editor, type in the code and then press space. You can also use an operator character to cause the abbreviation to transform into the desired symbol.

Labeling equations in Microsoft Word

I recently published a video about equation labels in Microsoft Word. It explains that it is easy to get displays like these. (The dashed line represents the right margin) This post also describes how to create these layouts.

Sample equations

The additional steps needed to make the labels count in sequence is a topic that this post doesn’t cover. The emphasis here is in creating expressions with Word.

To get these label results, I put a pound character (#) in an equation region at the end of the main equation. When I follow the # with the label and hit enter, the equation label will be separated and shifted to the right. Even though # is a reserved character in stock LaTeX, this use of # works when you are entering the equation with both Word’s LaTeX syntax as well as the less verbose Unicode formatting.

When you have text in an equation, it is created with a math font. Cambria Math is the default. When you change the font size, it affects the whole equation. If you change the font, it also affects the whole equation. Only math fonts are allowed. If you try to change the normally entered equation to a regular (non-math) font, the change is ignored. [Fonts for Mathematics, Johannes Küster describes some characteristics of a math font.] Several math fonts are available online.

Other attributes can be adjusted on a sub-expression by sub-expression basis. For example, bold and underline as well as color and highlighting can be changed with fine grain control. An interesting puzzle is to discover how to make a calculus integral expression with the integral sign in red and the rest of the equation black.

However, by enclosing text in double quotes and then accepting them, the quoted text can display different fonts and font sizes without changing the rest of the equation. The quotes are hidden when the equation is finished. This is possible in any part of an equation.

The labels are part of the equation so, unless the text after the # is enclosed in double quotes, it has the same features and limitations of any other equation. To put an expression such as \(\pi^2\) in the label, don’t include that part in double quotes so that the equation formatting syntax works there.

I am using Microsoft 365 current in May 2022 with the “Conversions” group of the Equation tab set to Unicode.

How I made these:

The rest of the article shows how I made the formulas above with minimal use of the mouse. The blue marks are created by a Windows accessibility option that highlights the location of the cursor.

Most of the work could also be done with the menus for those who make equations only rarely. I found that after doing several homework assignments with Word equations, I wanted to be faster than I could be with the menus.

Quadratic equation:

This equation is built-in, but in the example, I created it manually.

I’m diagraming the expression from the inside out. I marked ‘*’ where I used the spacebar. This equation does not require the mouse.

The chart shows the sub-expressions broken out to show what each piece displays. The appearance column shows what you display with each part composed on its own.

In the end, the last line of the table is enough. I would enter that text in sequence to create the final result. Hitting the enter key at the end of the entry finished the formatting.

AppearanceEquation text
b^2-4ac
\sqrt(b^2-4ac)*
-b+-\sqrt(b^2-4ac)*
(-b+-\sqrt(b^2-4ac)*)/2a*
x=(-b+-\sqrt(b^2-4ac)*)/2a*
x=(-b+-\sqrt(b^2-4ac)*)/2a*#(eq. 1)
quadratic equation steps

N choose k

For this example, I’ll diagram it as it’s enetered from left to right. I needed to use the mouse for a couple of steps.

I build the expressions as fractions. Then I used the context menus to hide the fraction bars, leaving the “n choose k” formatted conventionally.

Appearancetext to enter
(n/k)
=
(n/(n-k)
[hit space]
)
[hit space]
Select first numerator, right click and use menu
Select second numerator, right click and use menu
#(eq. 2)
[enter]
n choose k steps

Inequality

I used double quotes to input normal text in the middle of the equation (the “iff”). It treat the “iff” text as literal so that it isn’t italicized. To accomplish that, I create it in double quotes. In general, quote-escaped text is not italicized like other parts of a math expression.

In this example, I’m showing the steps in the order I took them.

typed a<b “iff”

typed [space]

typed a

Selected “Neither Greater Than nor Equal To” operator from the Operators subset of the Symbols group of the Equation tab

typed b#”and then?”

Hit [enter] to separate the label

selected the word “then” with the mouse

Changed the Arial Black font from the font pulldown on the Home tab

Final expression.


Answer

To color only the integral sign red, select the integral sub-expression; make the selection red; then select each sub-sub-expression and restore them to black.

YouTube captioning with Adobe Premiere

I use Adobe Premiere Pro to make captions for my YouTube videos easily.

My current workflow uses Camtasia to do the screen captures. I’m still learning so I’ll probably get more efficient as I go.

Once I’ve got a draft of the video ready, I export it from Camtasia into an MP4. I take that video and load it into Adobe Premiere Pro and use its closed captioning features to get a transcript of the audio. I can revise the script inside of Premiere.

Premiere will play back the video with a text cursor tracking the video. This makes it possible to stay synchronized when I re-record the audio with Audacity. (Even if I’ve made changes to the script.) My initial audio recording has a lot of keypress noises that I want to get rid of.

There is an advantage to importing the audio from Audacity’s .MP3: if I need to correct the audio later, I just need to change the MP3 itself. Camtasia imports the audio anew each time it starts. If I respect timing, the final audio will get my adjustments automagically. This is even true if I’ve split up the audio and rearranged it. One example of a later stage adjustment is to remove breath sounds. I still am learning audio recording techniques.

Once I have the video completely finished and ready to upload to YouTube, I load the MP4 into Premiere again and create a final transcription of the video. I edit it to correct voice recognition errors and to improve punctuation. This preserves the synchronization between the text and the video. I then export the captions into an .SRT file. This is much less work than trying to create the captions manually.

Once I’ve uploaded the video to YouTube, I go to the edit captions section and upload the saved captions. I play the captions through and use YouTube’s interface to correct the errors that I didn’t notice inside of Premiere. This is my first effort at this process: The Symbols Section of Words’s Equation Tab.

It’s nice to have several tools available at once.

Indiana Math Channel -> Smiling Y

I’ve been uncomfortable calling this Indiana Math Channel. The name seemed presumptuous and affected. My only motivation for using the name was the ease of searching for it and that I live in Indiana.

I’ve changed this name to Smiling Y as well as the name of the related YouTube account. It’s a name I’ve used for a long time, but it has never had any web content.

The old URLs indianamathchannel.com; blog.indianamathchannel.com and indianamathchannel.wordpress.com now all redirect here, blog.smilingy.com.

… Bill

Reduced Colors

If you start with the number 6 and organize the integers based on their remainder when divided by six, you have 6 sets. One set contains \(\{0, 6, 12, …, -6, -12, … \}\). Another set contains \(\{1, 7, 13, …, -5, -11, … \}\). A third \(\{2, 8, 14, …, -4, -10, … \}\). The last three are \(\{3, 9, 15, …, -3, -9, …\}\), \(\{4, 10, 16, …, -2, -8, … \}\) and \(\{5, 11, 17, …, -1, -7, -13 \}\).

If I use the lowest non-negative value in each set as its name, I can signify them by placing a bar over the number. The collection of 6 sets can be summarized as \(\{\overline{0}, \overline{1}, \overline{2}, \overline{3}, \overline{4}, \overline{5}\}\).

For the examples here, I’m going to reduce the list by throwing out all of the numbers that are not relatively prime to 6. Relatively prime means that they don’t have a common factor with 6. 2 is not relatively prime to 6 nor is 3 because they divide 6. Also 4 is not relatively prime because 2 divides both. I also discard 0 because all of the numbers in \(\overline{0}\) are have 6 as a common divisor. This leaves a much shorter list: \(\{\overline{1}, \overline{5}\}\)

What’s interesting about this reduced list is that, if you multiply any pair of its numbers, the product is still in the collection. \(1 \times 1 = 1\), \(1 \times 5 = 5\), \(5 \times 5 = 25\). If you simplify 25 modulo 6, you get 1, still within the reduced set.

In general, if you take an integer \(n\) and keep only the numbers that are relatively prime to \(n\), the result of any product is in one of the “residue classes” of the list. This means that a multiplication table of these products will only contain those relatively prime numbers.

For 5, 8, 10 and 12, there are four numbers in each reduced set. 5 has \(\{\overline{1}, \overline{2}, \overline{3}, \overline{4}\}\). 8 has \(\{\overline{1}, \overline{3}, \overline{5}, \overline{7}\}\). 10 has \(\{\overline{1}, \overline{3}, \overline{7}, \overline{9}\}\), and 12 has \(\{\overline{1}, \overline{5}, \overline{7}, \overline{11}\}\).

The product tables that result from these four sets are:

It’s not obvious whether any of these tables are equivalent and follow the same pattern. However, if you rewrite the table by replacing each number by its position in the set. I’m using the natural numeric order of the values. 7 is the third number in 12’s list, so 7 in replaced by 3. A similar substitution for each value, yields a new product table.

From these, it’s a little clearer to see that 5 and 10 are equivalent as are 8 and 12.

However, if you replace the numbers with colors, the information is even easier to see.


The numbers, 7, 9, 15 and 18 all reduce to sets of 6 numbers. When they are transformed into color arrays with similar procedure, you get these diagrams:

This shows that there are 3 different multiplicative groups coming from a reduced set of 6 values. 9 and 18 are equivalent while 7 and 14 are unique.

When you have the reduced sets represented with these color arrays, interesting patterns can become visible that are hidden if you just look at the values numerically.

Animation and communication

I’m working on a tool to help me do animation. My underlying technology is HTML and JavaScript. I’m trying to apply some of the principles of traditional animation to my process. The primary target for the tool is math explainers.

One idea from traditional animation that seems important is the idea of creating keyframes while drafting a presentation. In an animation, the keyframes would be images with gaps between them that would be filled in by artists as they create the continuity of the motion. I could apply this idea by making still images of important stages in the product. Then, I can do the magic of making things move smoothly with polish and flair. However, when the animation is generated algorithmically, the keyframes might be similar to an advanced storyboard.

Making a storyboard would also be helpful for planning. I could make (paper) sketches of where I want the narrative to go. However, I haven’t tried this for my current video, even though it probably should be the first thing I do. I’ve been so enamored with the animation software development that that’s been a distraction from my ultimate goal.

Another (potential) idea from storytelling is that the outline is often structured in a three-act framework. I don’t really have an intuition about how to apply that idea to communicate mathematics. It sounds promising, but I haven’t explored it yet. Part of my uncertainty is my lack of experience in analyzing the three-act structure.

Animation can be a really useful tool. I don’t want to lose sight that it is just a tool and should not override the process of communication. It’s so easy to get excited about animating things in a pretty way. I also want to explain each topic effectively.

This summer, Grant Sanderson, the creator behind the YouTube channel 3Blue1Brown, sponsored a math exposition contest. His announcement of the winners shared some principles that he used evaluate the submissions.

My understanding of his discussion about the contest is that first, the information should have a motivation. Why is the information interesting? What about the topic is meaningful to the videographer? He also wanted the videos to have clarity, empathy and to be engaging. Clarity requires the video to be succinct and direct. To me, empathetic means that the video should talk to its audience. It should be aware of difficult concepts and acknowledge the difficulty. Engaging means that the audience should want to pay attention to the explanation.

Other attributes that he used to evaluate submissions to the contest was whether the videos had good quality, novelty and were memorable. To me, quality means that the chosen tools are effective and used skillfully. Novelty means that the ideas should include something new. Perhaps a new explanation, an insight that unlocks the topic to a larger audience or that it is just different. Memorable content allows the important ideas to stick with the viewer.

I think these concepts are good benchmarks to aspire to in my releases.

Sometimes a video is a good way to present the information. At other times, the ideas are better shown with a document or an interactive website. Of course, these can all be used together. Animation can help a video contain these attributes from the contest. The right information for the right audience might need more than animation technology.